Hammersmith Flat Prices Reach New Record Level
While Ravenscourt Park home becomes area's second most expensive
Hammersmith flat prices reached all-time high in the third quarter of 2013, averaging £450,266.
This was up 10.6% on the second quarter, when the average was £407,164.
Prices rose in all four W6 postcodes, with the biggest jumps in the W6 7 area, around Brook Green, where the average rose from £411,231 to £481,119 and in W6 9, the area close to the river south of King Street and west of Fulham Palace Road, where it climbed by almost £100,000 from £352,493 to £446,498.
There was also a surge in transaction levels with 166 properties changing hands over the three month period, the highest for over six years, and up almost 40% on the last quarter's total of 119.
The overall average price fell by 6.9% compared to the same period last year to £693,062, though it was very slightly up when compared to the previous quarter, when the total was £683,734.
However, this drop can mainly be explained by the balance of properties sold, with just three detached homes and two semi-detached houses changing hands, compared with 50 terraced houses and 111 flats and maisonettes.

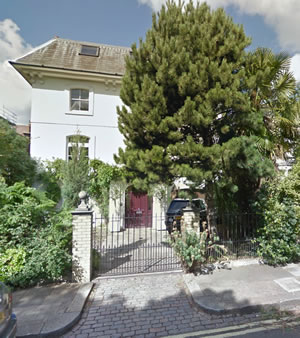
Despite the lack of movement at the top of the markt, this period did see a home in Ravenscourt Park become the second most expensive property ever sold in the W6 post code area. The eight bedroomed home sold for £4,200,000.
The apparent slowdown in Hammersmith's highest priced homes is not down to lack of demand - in fact, says Paul Price Associate Director with agent Marsh and Parsons, demand for property in Brook Green and Brackenbury Village is at an all time high. But he says: " A continued lack of stock coupled with an increase in the number of buyers registering with our local Brook Green office has resulted in 19 buyers registered for every available property for sale.
" Many buyers are migrating from Prime Central London including neighbouring areas in the Royal Borough of Kensington and Chelsea, attracted by the local ‘village’ feel, the great schools, the unrivalled transport links, and most importantly, the cheaper price tag.
"
That said, the discount afforded in this area
compared to neighbouring suburbs such as
Notting Hill and Holland Park, continues to
reduce, as investors enjoy higher returns
in terms of rental yields for buy-to-let
investments, coupled with a stronger capital
growth compared to Prime Central London.
"
Indeed, the rate at which prices are increasing
in some cases is staggering. For example,
we’ve just sold a flat on Warwick Gardens for £616,000; we sold the same flat in the same
condition in 2011 for £470,000 – an incredible
31% increase in just under two years.
"
And it’s
not just flats. We sold a house on Wolverton
Gardens W6, in the summer of 2012 for
£945,000; exactly a year later, we sold the
same property for £1,135,000 – a 20% increase."
Meanwhile, the September data from Land Registry's House Price Index shows that London remains the best performing property market in England and Wales. The average price of a home in the capital rose by 9.3% over the year to £393,462.
Jon Pishiri, RICS London residential spokesperson says: " Increasing demand and continuing low supply are major determinants in London prices being pushed up. The Help to Buy initiative coupled with rising rental values are further encouraging people to purchase a house as opposed to renting. There is an obvious need to increase supply to the market in order to address this problem."
For the country as a whole prices rose by 3.4% taking the average property value in England and Wales to £167,063. Repossession volumes decreased by 28 per cent in July 2013 to 1,187 compared with 1,645 in July 2012.
The number of properties sold in England and Wales for over £1 million in July 2013 increased by 34 per cent to 1,143 from 852 in July 2012.
A detailed listing of properties sold recently in the area will be appearing in a forthcoming edition of the Hammersmith newsletter.
| Hammersmith Property Prices (July - September 2013) | ||||||||||
|---|---|---|---|---|---|---|---|---|---|---|
| Area | Detached | Sales | Semi-Det | Sales | Terraced | Sales | Flat/Mais | Sales | Total Ave. | Total Sales |
| W6 0 | 2728000 | 3 | 2375000 | 1 | 1189632 | 19 | 452027 | 36 | 837881 | 59 |
| W6 7 | 0 | 0 | 0 | 0 | 1350000 | 4 | 481189 | 33 | 575115 | 37 |
| W6 8 | 0 | 0 | 0 | 0 | 969657 | 15 | 395072 | 18 | 656247 | 33 |
| W6 9 | 0 | 0 | 825000 | 1 | 928083 | 12 | 446498 | 24 | 612918 | 37 |
| Total | 2728000 | 3 | 1600000 | 2 | 1073697 | 50 | 450266 | 111 | 693062 | 166 |
| Last quarter | - | - | - | - | -2.8% | 42.9% | 10.6% | 42.3% | 1.4% | 39.5% |
| Last year | - | - | 31.8% | -33.3% | -14.6% | 16.3% | 12.6% | 63.2% | -6.9% | 45.6% |
| Last three years | - | - | 27.9% | -60.0% | 23.9% | 2.0% | 18.2% | 44.2% | 16.3% | 26.7% |
| Last five years | - | - | 4.6% | -60.0% | 75.8% | 117.4% | 31.1% | 170.7% | 33.7% | 140.6% |
| Last ten years | - | - | 155.2% | -60.0% | 109.3% | -32.4% | 76.9% | -22.4% | 98.5% | -25.2% |
Source: Land Registry
November 20, 2013
Related links
|