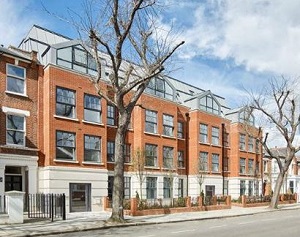
Hammersmith Property Market Hit as Luxury Flats Fail to Sell
Average flat price in some areas drops by up to 50% in two years
Hammersmith property prices have recovered judging by the most recent sales but are still down over the year.
The overall property price in the W6 post code area fell by 5.2% during 2016, to £858,882 in the final quarter, down from
£898,647 in the same period a year before - which was itself a sharp drop from the beginning of 2015, when it soared above the million mark to reach an all time high of
£1,011,362.
This precipitous drop is mainly down to a single factor - the slump in sales of high priced luxury apartments at Hammersmith's riverside developments.
While the average price of terraced houses rose over the year by 15.4% to reach £1,585,866, the value of flats went in the opposite direction, down by 17% to £586,258 from £706,818 in the same period in 2015. And again, that figure was itself a sharp fall from the beginning of 2015 when it reached £899,848.
The area where this switch from an upward to downward trend is most obvious is W6 9, which includes upmarket riverside development Fulham Reach.
In the first three months of 2015, with sales at this development buoyant, the average price of flats in this area soared to £1,409,660.
Since then, sales have slowed and during the last three months however, Land Registry figures record no sales at all at Fulham Reach, or at nearby riverside development Queen's Wharf, with the result that the average price for this postcode area fell by over 50% to £604,980.
Developer St George will now be hoping that buyers will be back in 2017 at Fulham Reach, where two and three bedroom apartments are currently priced from £1,850,000 and £4,999,950.
There was better news during this period for another Hammersmith development, Bellway's Bentley Place in Bute Gardens, where ten sales were recorded during the period. Flats here have a relatively more affordable price tag of between £799,950 and £1,204,995.
The most expensive house sold during this period, meanwhile was a five bedroom terraced property overlooking Brook Green which changed hands for £3,950,000.
For local estate agents, the worst news contained in the figures was the overall slowdown in the market, with the number of transactions falling by almost a half over the year to just 60.
However, this period at the end of the year is traditionally a quiet one, and Alex Maile, MD of local estate agents Lawson Rutter says he expects things to speed up again in spring. He predicts: "The property market will grow in strength as we approach the spring period, which, as the result of pent up demand, we expect to be extra busy this year."
Pointing out that prices across the country rose by almost 7% in 2016 - better than many experts had expected - he adds: "The general consensus seems to be that prices rises will slow a little this year as a result of the ongoing uncertainties over Brexit, though this will be offset, somewhat, by supply shortages and low interest rates."
The Office of National Statistic's House Price Index is showing that the average price of a home sold in England and Wales was £219,544 in December 2016 up by 7.2%. Having been consistently above the levels seen in the rest of the country prices in London are now rising less quickly than the overall average and now stands at £484,000. This is the first time home values in the capital have underperformed the rest of the country since the financial crisis in 2008.
The number of property sales in England in October 2016, the latest figure available was down 34.5% year on year.
| Hammersmith Property Prices (October-December 2016) | ||||||||
|---|---|---|---|---|---|---|---|---|
Area |
Semi- |
Sales |
Terrace |
Sales |
Flat/ |
Sales |
Overall Ave |
Overall Sales |
| W6 0 | 0 | 0 | 1805231 | 8 | 502906 | 16 | 937015 | 24 |
| W6 7 | 0 | 0 | 3950000 | 1 | 682290 | 18 | 854275 | 19 |
| W6 8 | 0 | 0 | 1001750 | 4 | 417167 | 3 | 751214 | 7 |
| W6 9 | 950000 | 1 | 991666 | 3 | 604980 | 6 | 755488 | 10 |
| Total | 950000 | 1 | 1585866 | 16 | 586258 | 43 | 858882 | 60 |
| Last quarter | - | - | 20.8% | -46.7% | 3.5% | -49.4% | 11.2% | -48.3% |
| Last year | - | - | 15.4% | -33.3% | -17.0% | -48.2% | -5.2% | -45.5% |
| Last three years | - | - | 15.8% | -56.8% | 35.8% | -54.7% | 13.5% | -56.8% |
| Last five years | - | - | 125.1% | -60.0% | 56.2% | -54.3% | 73.9% | -56.8% |
| Last ten years | - | - | 132.5% | -73.3% | 89.9% | -62.6% | 94.5% | -66.3% |
Source: Land Registry
March 17, 2017
Related links
|

